
In the course of my business as a real estate appraiser, broker, and consultant, I review the market after the end of the year and forecast my expectations for the following year.
I do this within the context of an annual housing study. It is always an interesting process because the market is so dynamic and ever-changing.
Participants are usually quite leveraged, so the future is intriguing for all involved – buyers, sellers, lenders, developers, investors, etc.
Over the past six weeks I have looked at a dizzying amount of data, statistics and forecasts from a wide variety of sources. The majority of articles I read neglect to show the big picture with respect to the resale housing market, especially for us in Chico.
What strikes me as most interesting are some of the bubble graphs. They tend to be general and fail to show how our beloved Chico fits into the big picture.
So I have endeavored to create a number of graphs to see what is actually going on.
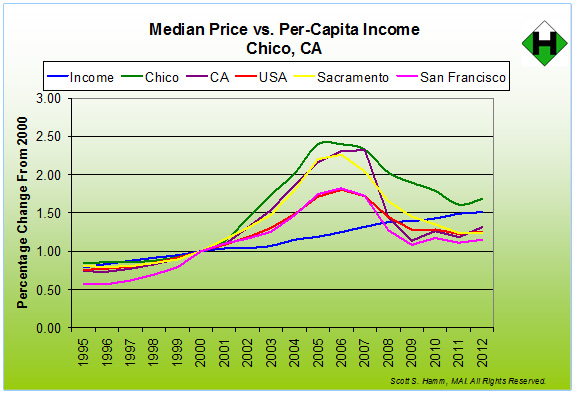 In short, the chart at right displays the median home prices for the United States, California, Sacramento, San Francisco and Chico from 1995 through 2012.
It also displays the growth in per-capita income in blue. Historically, there has been parity between the rise in incomes and the rise in housing prices as reflected between 1995 and 2000. The year 2000 is set as a base to show the percentage change in the median home price and incomes both before and after that year.
As is no surprise, there is a large “bubble” across all markets, generally peaking in about the middle of 2006. Home prices at these levels are viewed as unsustainable, because the incomes are not there to support the housing prices.
Why did this happen?
Reckless lending policies were the main culprit, and acted to fuel the fire of a normal cyclical increase in prices. As prices increased rapidly, buyers reacted with unrealistic expectations of extended price increases, and this made matters worse by continuing the upward price spiral.
Then the financing spigot was turned off.
As can be seen, there was a precipitous drop in prices after the peak, which lasted for over five years. The good news is, the decline in prices is over for now and we are back on the road to recovery. Look for the median home price in Chico to increase by 6 percent to 8 percent in 2013.
It is interesting to note that Chico performed better on the upswing than the nation, state, Sacramento or San Francisco. Moreover, it fared far better on the downswing, which is most important for those fortunate enough to have been able to purchase a house prior to 2001, and those privileged enough to have been able to hang on through the down cycle.
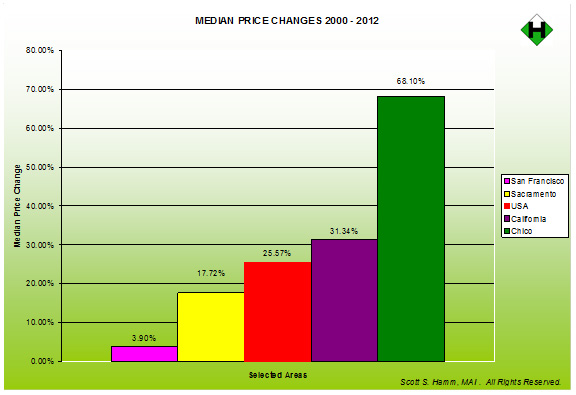 The chart at right displays the change in median price for the same areas since 2000. It clearly shows Chico’s prices holding up very well at a compounded annual appreciation rate of 4.42 percent or 68.10 percent over the period shown.
This may well be because the secret is out, and Chico is a wonderful place to live. There are good people, great schools, a distinguished university and community college, a magnificent hospital, terrific employers, and a remarkable city park and environment in which to live and recreate.
I really think the housing market is demonstrating, over a sustained period of time, that Chico really is the best place to live.
However, this does raise affordability issues, which I’ll leave for another article. Stay tuned.


Comments are closed.